Showing posts with label Angola. Show all posts

Monday, December 6, 2021

84. Southern Africa - a summary of temperature trends

Over the last fifteen months I have analysed the temperature data for nine different countries in southern Africa and calculated their temperature trends. My analysis began in September 2020 with South Africa (Post 37) before continuing on to Botswana (Post 38) and Namibia (Post 39) in October. More recently I have examined the temperature records of Madagascar (Post 77), Mozambique (Post 78), Zimbabwe (Post 79), Zambia and Malawi (Post 81), and Angola (Post 82).

The one constant for all these countries is the temperature trend since 1980. In almost all cases the climate shows evidence of warming, with the temperature rise varying between 0.5°C and 1.5°C. Before 1980 the picture is different with little or no temperature rise being seen, and in many cases (e.g. Madagascar, Zimbabwe, Zambia and Malawi) a significant cooling taking place. These results are summarized in the graphs below.

The main conclusions to be drawn here are as follows.

  • All the warming in southern Africa has occurred since 1980.
  • There is probably no warming before 1980, and possibly some cooling.
  • The net warming since 1850 is likely to be between 0.5°C and 1.0°C. This is less than the IPCC global value of 1.3°C, and much less than the land-based Berkeley Earth average of almost 2.0°C (see Fig. 80.1 in Post 80).

In the New Year I will return to the African data and analyse the data from countries in sub-Saharan and equitorial countries. In the meantime I will return to considering the physics of the Greenhouse Effect that I introduced in Post 12 (black-body radiation) and Post 13 (Earth's energy budget). In particular I will look to answer two questions: why is Venus so hot, and why is Mars so cold?


Fig. 37.2: The mean temperature anomaly (MTA) for South Africa since 1840. The best fit is applied to the interval 1857-1976 and has a gradient of +0.017 ± 0.056 °C per century. The monthly temperature changes are relative to the 1961-1990 monthly averages.


Fig. 38.3: The mean temperature anomaly (MTA) for Botswana since 1917. The best fit is applied to the interval 1917-1976 and has a positive gradient of +0.72 ± 0.26 °C per century. The monthly temperature changes are defined relative to the 1961-1990 monthly averages.
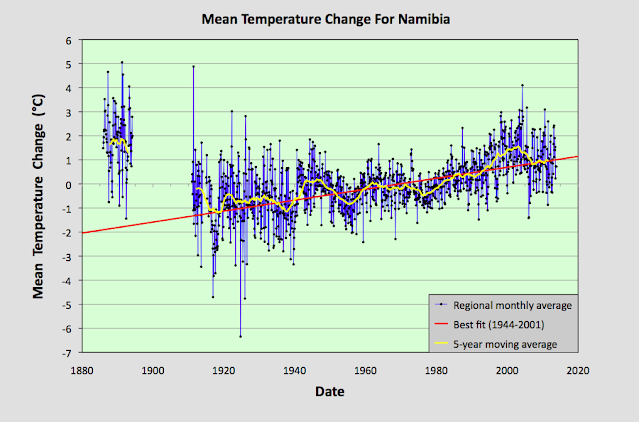


Fig. 39.8: The mean temperature anomaly (MTA) for Namibia since 1885. The best fit is applied to the interval 1944-2001 and has a positive gradient of +2.28 ± 0.17 °C per century. The monthly temperature changes are defined relative to the 1971-1990 monthly averages.


Fig. 77.6: The mean temperature anomaly (MTA) for Madagascar. The best fit is applied to the monthly mean data from 1932 to 2011 and has a negative gradient of -0.15 ± 0.07 °C per century.


Fig. 78.6: The mean temperature anomaly (MTA) relative to the 1931-1960 monthly averages for stations in Mozambique with over 300 months of data but excluding Lourenço Marques. The best fit is applied to the monthly mean data from 1921 to 1980 and has a positive gradient of +0.16 ± 0.12 °C per century.


Fig. 79.2: The mean temperature anomaly (MTA) for Zimbabwe relative to the 1971-2000 monthly averages based on an average of anomalies from stations with over 360 months of data. The best fit is applied to the monthly mean data from 1916 to 1975 and has a negative gradient of -0.96 ± 0.20 °C per century.


Fig. 81.2: The mean temperature anomaly (MTA) relative to the 1951-1980 monthly averages based on an average of anomalies from stations with over 360 months of data. The best fit is applied to the monthly mean data from 1921 to 1975 and has a negative gradient of -2.72 ± 0.17 °C per century.


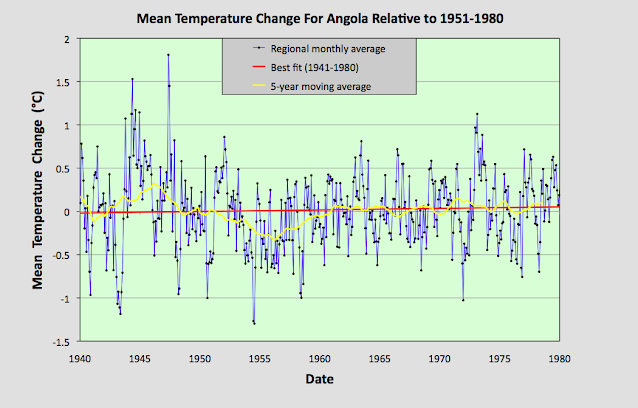
Fig. 82.5: The mean temperature anomaly (MTA) for Angola relative to the 1951-1980 monthly averages based on an average of anomalies from stations with over 300 months of data. The best fit is applied to the monthly mean data from 1941 to 1980 and has a positive gradient of 0.18 ± 0.17 °C per century.


Tuesday, November 30, 2021

82. Angola - temperature trends STABLE

The biggest problem we are confronted with when it comes to determining the extent of climate change in Angola is a lack of temperature data. There is only one long station with over 1200 months of data and another four medium stations with over 480 months of data. Only two stations have a significant quantity of data before 1939, and they are both in the capital Luanda; and none have any reliable data after 1980 due to the protracted civil war. A full list of stations for Angola can be found here.

If we include stations with over 240 months of data, then there are a total of eighteen temperature records that we can use. Their locations are indicated on the map below in Fig. 82.1. Overall they are fairly evenly distributed across the country, although the stations with the longest temperature records are generally found nearest the coast. The consequence of this deficit of data is that it is impossible to definitively determine the temperature trend for the country either before 1940, or after 1980. Between 1940 and 1980 the data suggests that no warming took place.


Fig. 82.1: The (approximate) locations of the main weather stations in Angola. Those stations with a high warming trend between 1901 and 2000 are marked in red while those with a cooling or stable trend are marked in blue.


The monthly anomalies for each station were created in the usual manner, as outlined in Post 47. First a suitable thirty year interval was chosen for calculating the monthly reference temperatures (MRTs). In this case the period 1951-1980 was chosen as that corresponded to the interval that overlapped with the maximum number of station records. The twelve MRTs for each station dataset were calculated for each of the twelve months by averaging the monthly temperatures in the reference period for that station. The MRTs were then subtracted from all the respective monthly temperature data for that station to generate the anomalies. The anomalies from all the stations were then averaged to give the mean temperature anomaly (MTA) for the region in that month. Employing a simple average of the station data rather than using Kriging, homogenization and gridding is sufficiently accurate if the stations are fair evenly distributed, which the map in Fig. 82.1 suggests to be the case. The resulting mean temperature anomaly since 1875 is shown below in Fig. 82.2.


Fig. 82.2: The mean temperature anomaly (MTA) for Angola relative to the 1951-1980 monthly averages based on an average of anomalies from stations with over 300 months of data. The best fit is applied to the monthly mean data from 1881 to 1980 and has a positive gradient of 1.39 ± 0.08 °C per century.


The MTA in Fig. 82.2 exhibits a similar warming profile to the IPCC global trends, but this is somewhat misleading. The data before 1939 is based on only two stations, and both of these are situated in the capital Luanda (Berkeley Earth ID 151475 and 2824), while the data after 1980 is highly sporadic and discontinuous for all stations with data in this period. This is illustrated in Fig. 82.3 below which shows the station frequency count in the MTA in Fig. 82.2. 


Fig. 82.3: The number of station records included each month in the mean temperature anomaly (MTA) trend in Fig. 82.2.


The station with the longest data set is Luanda (Berkeley Earth ID 151475), the monthly anomalies of which are shown in Fig. 82.4 below. The second station in Luanda (Berkeley Earth ID 2824) has no data after 1973, while its data after 1951 is virtually identical to that of station 151475. Before 1951, however, the data from the two stations disagree by an average of almost 0.5°C. This hints that the two sets of station data may not be completely independent, or may be the result of combining other datasets.


Fig. 82.4: The temperature anomaly for Luanda relative to the 1951-1980 monthly averages. The best fit is applied to all the monthly mean data and has a positive gradient of 1.63 ± 0.06 °C per century.


The main conclusion to be drawn from Fig. 82.3 is that both the data before 1939 and the data after 1980 are unreliable. The data after 1980 is unreliable because there is so little of it, and it is highly fragmented. The data before 1939 is unreliable because it is based on just two stations that are located in the most highly populated region of the country. While these two stations do corroborate each other, particularly after 1951, they are still unlikely to be representative of the climate of the country as a whole. We know this because we see it in many countries and regions: strong warming in the major cities like Jakarta (see Post 31), Sydney (BE-151986) in NSW (Post 18) and Melbourne (BE-151813) in Victoria (Post 19), but a totally different temperature trend in the surrounding region.


Fig. 82.5: The mean temperature anomaly (MTA) for Angola relative to the 1951-1980 monthly averages based on an average of anomalies from stations with over 300 months of data. The best fit is applied to the monthly mean data from 1941 to 1980 and has a positive gradient of 0.18 ± 0.17 °C per century.


If we therefore just look at the data from 1940 to 1980 we see that there is no significant warming (see Fig. 82.5 above). The slight rise in the best fit line is at least five times less than the standard deviation of the MTA, and is almost the same as the uncertainty in the best fit. And this is also similar to the extent of the warming claimed by Berkeley Earth for this period (see Fig. 82.6 below).


Fig. 82.6: The temperature trend for Angola since 1840 according to Berkeley Earth.


However, the temperature trend for Angola according to Berkeley Earth (BE) does exhibit strong warming both before 1939 and after 1980. While the latter is certainly a reasonable assumption based on trends elsewhere in the region, it is not a conclusion that can be confidently presented based on the available data. As for the data in Fig. 82.6 before 1939, this may be supported by the station data from Luanda, but it differs significantly from the trends I have determined for neighbouring countries such as Namibia (Post 39), Botswana (Post 38), Zambia (Post 81) and Zimbabwe (Post 79).


Summary

Temperatures in Angola between 1939 and 1980 appear to be stable.

There is insufficient data to determine the extent of climate change in Angola either before 1939, or after 1980.


Acronyms

BE = Berkeley Earth.

MRT = monthly reference temperature (see Post 47).

MTA = mean temperature anomaly.