When it comes to analysing the temperature data of Belarus the biggest problem is the low quantity of data. There is no data before 1880 and only three stations have data before 1950, two of which are long stations with over 1200 months of data (for a full list of stations see here). On a more positive note, there are seventeen medium stations with over 480 months of data and these are quite evenly distributed across the country. That means it should be possible to construct a reliable measure of the overall mean temperature change for Belarus, at least for the last sixty years. What this data then shows is that the climate of Belarus appears to have been fairly stable over the hundred years prior to 1980, but then in 1988, like much of Europe, the temperature suddenly increased by about 1.1°C (see Fig. 152.1 below).

Fig. 152.1: The mean temperature change for Belarus since 1880 relative to the 1981-2010 monthly averages. The best fit is applied to the monthly mean data from 1881 to 1980 and has a statistically insignificant positive gradient of +0.23 ± 0.23 °C per century. After 1980 there is an abrupt warming of 1.1°C.
In order to quantify the changes to the climate of Belarus the temperature anomalies for all stations with over 480 months of data before 2014 were determined and averaged. This was done using the usual method as outlined in Post 47 and involved first calculating the temperature anomaly each month for each of the nineteen valid stations relative to its own monthly reference temperature (MRT). Then those anomalies were averaged to determine the mean temperature anomaly (MTA) for the whole country for each month. The MRTs for each station in Belarus were calculated using the same 30-year period, namely from 1981 to 2010. The resulting MTA for Belarus is shown as a time series in Fig. 152.1 above and clearly shows that temperatures were rising slowly (at about 0.23°C per century) for about 100 years up until 1980 but that this rise was only comparable to the uncertainty in the trend and so is not significant. After 1980, however, the MTA suddenly increases by about 1.1°C. Such behaviour is seen in the MTA for many other European countries and for Europe as a whole (see Post 44).
The total number of stations included in the MTA in Fig. 152.1 each month is shown in Fig. 152.2 below. The peak in the frequency after 1970 indicates why the 1981-2010 interval was determined to be the most appropriate to use for calculating the MRTs in this case.

Fig. 152.2: The number of station records included each month in the mean temperature anomaly (MTA) trend for Belarus in Fig. 152.1.
The locations of the nineteen stations used to calculate the MTA in Fig. 152.1 are indicated on the map in Fig. 152.3 below. These stations appear to be distributed very evenly across the country with no significant clusters. This means that a simple average of their temperature anomalies should be just as accurate as any of the gridding or homogenization processes that are used by the main climate science groups in their analyses.

Fig. 152.3: The (approximate) locations of the 19 longest weather station records in Belarus. Those stations denoted with squares are long stations with over 1200 months of data, while diamonds denote medium stations with more than 480 months of data.
If we next consider the change in temperature based on Berkeley Earth (BE) adjusted data we get the MTA data in Fig. 152.4 below. This again was determined by averaging the anomalies each month from the nineteen longest stations and also suggests that the climate was warming very slightly before 1980 and then more rapidly thereafter. In this case, however, the post-1980 warming is more continuous and gradual in nature than that seen in the raw data in Fig. 152.1.

Fig. 152.4: Temperature trends for Belarus based on Berkeley Earth adjusted data. The best fit linear trend line (in red) is for the 12-month moving average data over the period 1881-1980 and has a positive gradient of +0.25 ± 0.08°C/century.
If we compare the curves in Fig. 152.4 with those from the published Berkeley Earth (BE) version for Belarus shown in Fig. 152.5 below, we see that there is excellent agreement between the two sets of data at least as far back as 1880. This indicates that the simple averaging of adjusted anomalies used to generate the BE MTA in Fig. 152.4 is as effective and accurate as the more complex gridding method used by Berkeley Earth in Fig. 152.5. In which case simple averaging should be just as effective and accurate in generating the MTA using raw unadjusted data in Fig. 152.1. What is more difficult to explain is how Berkeley Earth was able to determine the mean temperature of Belarus as far back as 1750 when there appears to be no reliable data before 1880.
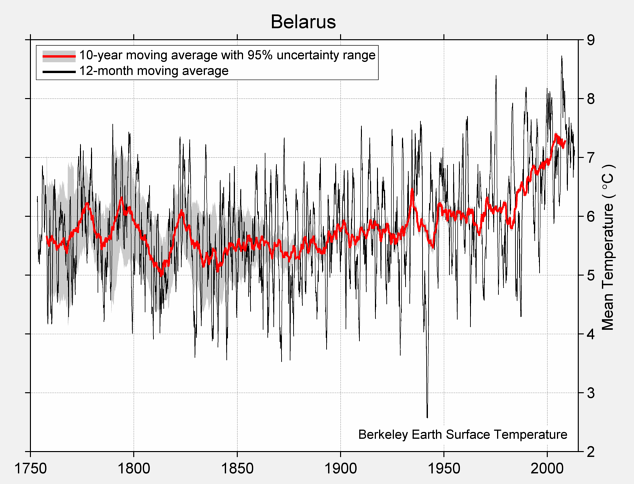
Fig. 152.5: The temperature trend for Belarus since 1750 according to Berkeley Earth.
But if we next compare the adjusted data in Fig. 152.4 with the raw data shown in Fig. 152.1 we see that there is excellent agreement between these two sets of data as well (see Fig. 152.6 below).

Fig. 152.6: A comparison of the 5-year mean temperature change for Belarus since 1880 between the original raw data from Fig. 152.1 (in blue) and the Berkeley Earth adjusted data from Fig. 152.4 (in red).
The small differences between the MTA from the raw data in Fig. 152.1 and that from the BE adjusted data in Fig. 152.4 are mainly due to the data processing procedures used by Berkeley Earth. These include homogenization, gridding, Kriging and most significantly breakpoint adjustments. These lead to changes to the original temperature data, the magnitude of these adjustments being the difference in the MTA values seen in Fig. 152.1 and Fig. 152.4. The magnitudes of these adjustments are shown graphically in Fig. 152.7 below.

Fig. 152.7: The contribution of Berkeley Earth (BE) adjustments to the anomaly data in Fig. 152.4 after smoothing with a 12-month moving average. The blue curve represents the total BE adjustments including those from homogenization. The linear best fit (red line) to these adjustments for the period 1911-2010 has a negative gradient of -0.242 ± 0.016 °C per century. The orange curve shows the contribution just from breakpoint adjustments.
The blue curve in Fig. 152.7 is the difference in MTA values between adjusted (Fig. 152.4) and unadjusted data (Fig. 152.1), while the orange curve is the contribution to those adjustments arising solely from breakpoint adjustments. Both are relatively small with the former adding a slight cooling to the data since 1911 of about 0.24°C. The large offset between the blue curve and the orange curve in Fig. 152.7 is due to the different MRT intervals used for calculating the anomalies in Fig. 152.1 (1981-2010) and in Fig. 152.4 (1961-1990).

Fig. 152.8: A comparison of the 5-year mean temperature change for Belarus (blue curve) with that of the Baltic States in Post 51 (red curve).
As mentioned at the start of this post, the main weakness of the data for Belarus is the lack of good data before 1950 which obviously raises questions over its accuracy and reliabilty. One way to test the accuracy is to compare the Belarus data with that from neighbouring states to see what the level of similarity is. This has been done in Fig. 152.8 above where the comparator set is data from the Baltic States in Post 51. As can clearly be seen, the level of agreement between the two datasets is very good, particularly after 1950. However, even before 1950 there is good agreement even though the Belarus temperature trend is based on data from three stations at most. This suggests that the MTA for Belarus in Fig. 152.1 is reliable and likely to reflect the true climate of Belarus as far back as 1880.
Summary
The raw temperature data for Belarus clearly shows that the climate was stable up until 1980. Any warming in the trend over this period was significantly less than the natural variation in the mean temperature anomaly (MTA) that was seen for all timescales up to ten years in duration (see Fig. 152.1 and Fig. 152.4).
After 1980 the climate has warmed sharply by about 1.1°C. This behaviour is similar to patterns seen across Europe. The reason for this abrupt temperature increase is still unknown as it does not correlate with increases in carbon dioxide levels in the atmosphere.
There appears to be a very good level of correlation between the MTA trend for Belarus and that for the Baltic States reported in Post 51. This allows each to in effect corroborate the other and therefore strengthen the validity of each.
Acronyms
BE = Berkeley Earth.
MRT = monthly reference temperature (see Post 47).
MTA = mean temperature anomaly.
Long station = a station with over 1200 months (100 years) of data before 2014.
Medium station = a station with over 480 months (40 years) of data before 2014.
List of all stations in Belarus with links to their raw data files.


