Showing posts with label Mozambique. Show all posts

Monday, December 6, 2021

84. Southern Africa - a summary of temperature trends

Over the last fifteen months I have analysed the temperature data for nine different countries in southern Africa and calculated their temperature trends. My analysis began in September 2020 with South Africa (Post 37) before continuing on to Botswana (Post 38) and Namibia (Post 39) in October. More recently I have examined the temperature records of Madagascar (Post 77), Mozambique (Post 78), Zimbabwe (Post 79), Zambia and Malawi (Post 81), and Angola (Post 82).

The one constant for all these countries is the temperature trend since 1980. In almost all cases the climate shows evidence of warming, with the temperature rise varying between 0.5°C and 1.5°C. Before 1980 the picture is different with little or no temperature rise being seen, and in many cases (e.g. Madagascar, Zimbabwe, Zambia and Malawi) a significant cooling taking place. These results are summarized in the graphs below.

The main conclusions to be drawn here are as follows.

  • All the warming in southern Africa has occurred since 1980.
  • There is probably no warming before 1980, and possibly some cooling.
  • The net warming since 1850 is likely to be between 0.5°C and 1.0°C. This is less than the IPCC global value of 1.3°C, and much less than the land-based Berkeley Earth average of almost 2.0°C (see Fig. 80.1 in Post 80).

In the New Year I will return to the African data and analyse the data from countries in sub-Saharan and equitorial countries. In the meantime I will return to considering the physics of the Greenhouse Effect that I introduced in Post 12 (black-body radiation) and Post 13 (Earth's energy budget). In particular I will look to answer two questions: why is Venus so hot, and why is Mars so cold?


Fig. 37.2: The mean temperature anomaly (MTA) for South Africa since 1840. The best fit is applied to the interval 1857-1976 and has a gradient of +0.017 ± 0.056 °C per century. The monthly temperature changes are relative to the 1961-1990 monthly averages.


Fig. 38.3: The mean temperature anomaly (MTA) for Botswana since 1917. The best fit is applied to the interval 1917-1976 and has a positive gradient of +0.72 ± 0.26 °C per century. The monthly temperature changes are defined relative to the 1961-1990 monthly averages.
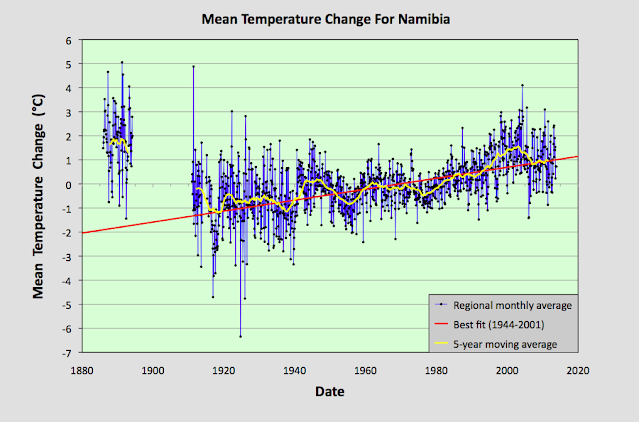


Fig. 39.8: The mean temperature anomaly (MTA) for Namibia since 1885. The best fit is applied to the interval 1944-2001 and has a positive gradient of +2.28 ± 0.17 °C per century. The monthly temperature changes are defined relative to the 1971-1990 monthly averages.


Fig. 77.6: The mean temperature anomaly (MTA) for Madagascar. The best fit is applied to the monthly mean data from 1932 to 2011 and has a negative gradient of -0.15 ± 0.07 °C per century.


Fig. 78.6: The mean temperature anomaly (MTA) relative to the 1931-1960 monthly averages for stations in Mozambique with over 300 months of data but excluding Lourenço Marques. The best fit is applied to the monthly mean data from 1921 to 1980 and has a positive gradient of +0.16 ± 0.12 °C per century.


Fig. 79.2: The mean temperature anomaly (MTA) for Zimbabwe relative to the 1971-2000 monthly averages based on an average of anomalies from stations with over 360 months of data. The best fit is applied to the monthly mean data from 1916 to 1975 and has a negative gradient of -0.96 ± 0.20 °C per century.


Fig. 81.2: The mean temperature anomaly (MTA) relative to the 1951-1980 monthly averages based on an average of anomalies from stations with over 360 months of data. The best fit is applied to the monthly mean data from 1921 to 1975 and has a negative gradient of -2.72 ± 0.17 °C per century.


Fig. 82.5: The mean temperature anomaly (MTA) for Angola relative to the 1951-1980 monthly averages based on an average of anomalies from stations with over 300 months of data. The best fit is applied to the monthly mean data from 1941 to 1980 and has a positive gradient of 0.18 ± 0.17 °C per century.


Thursday, September 30, 2021

78. Mozambique - temperature trend 0.6°C WARMING after 1980

According to climate science, Mozambique has experienced a more or less continuous warming to its climate of over 1.2°C over the last 130 years. The reality as evidenced by the actual temperature data is rather different. Like many places around the world, Mozambique has certainly seen some modest warming of about 0.6°C since 1980, but before 1980 the picture is uncertain, and on balance there may have been no significant warming at all in this period.

Mozambique has eleven long and medium weather stations most of which are located on, or near, the coast, as indicated in Fig. 78.1 below. This is same number of long and medium weather stations that was seen for Madagascar (see Post 77). However Madagascar also has another nine stations with over 300 months of data; Mozambique has only four.


Fig. 78.1: The (approximate) locations of the weather stations in Mozambique. Those stations with a high warming trend between 1901 and 2000 are marked in red while those with a cooling or stable trend are marked in blue. Those denoted with squares are stations with over 1000 months of data, while diamonds denote stations with over 480 months of data.


Of the eleven long and medium stations in Mozambique, two are long stations with over 1200 months of data, another two have over 1000 months of data, and the remaining seven are medium stations with over 480 months of data. Averaging the temperature anomalies from these eleven station records results in the mean temperature anomaly (MTA) for the region shown in Fig. 78.2 below. The method used to determine the MTA was the same as that used in previous posts and has been outlined in Post 47

First the monthly reference temperatures (MRTs) were calculated for a suitable time interval, in this case the thirty year period from 1951 to 1980. This ensured that all eleven long and medium temperature records contained sufficient valid data in this interval for each month (a minimum of twelve years of data for each MRT is usually required). The MRTs for each set of station data were then subtracted from the raw monthly temperature readings to produce the anomalies for that station location. The anomalies from all eleven long and medium station records were then averaged to determine the MTA.


Fig. 78.2: The temperature trend for Mozambique relative to the 1951-1980 monthly averages based on an average of anomalies from stations with over 480 months of data. The best fit is applied to the monthly mean data from 1913 to 2012 and has a positive gradient of +1.07 ± 0.06 °C per century.


The MTA data in Fig. 78.2 appears to show an upward trend of about 1°C per century, but that is not the whole story. As Fig. 78.3 below indicates, the number of stations that contribute to the MTA drops significantly as you go back in time before 1950. This in turn suggests that the trend in Fig. 78.2 after 1960 is much more reliable than that before 1930.


Fig. 78.3: The number of station records included each month in the mean temperature anomaly (MTA) trend for Mozambique in Fig. 78.2.


As usual I have compared my results based on raw temperature data with the Berkeley Earth (BE) version based on their adjusted data. The equivalent average of the BE adjusted anomalies is shown below in Fig. 78.4. From 1940 onwards it is very similar to the trend from the raw temperature data shown in Fig. 78.2 above. In both cases the MTA plateaus between 1940 and 1980 before rising by about 0.8°C over the next twenty years. Then it drops back slightly by about 0.2°C in the following decade.


Fig. 78.4: Temperature trends for Mozambique based on Berkeley Earth adjusted data. The average is for anomalies from all stations with over 360 months of data. The best fit linear trend line (in red) is for the period 1911-2010 and has a gradient of +1.00 ± 0.03°C/century.


The MTA based on BE adjusted data also shows good agreement between 1920 and 1990 with the official Berkeley Earth trend for Mozambique shown in Fig. 78.5 below. It is only after 1995 that there is significant disagreement between the two plots. This may be because Berkeley Earth has included more data in the average after 2000 using many more stations with less than 300 months of data than I have.


Fig. 78.5: The temperature trend for Mozambique since 1840 according to Berkeley Earth.


It is clear that the temperature trend for Mozambique exhibits some warming after 1980, but the trend before 1980 is less clear. However, if we look at all the available data (see here for a list of all stations in Mozambique) we do see that there are a number of stations with data from 1930 to 1960 that are not included in the MTA trend shown in Fig. 78.2 above, due to insufficient data within the MRT period. It turns out that the temperature time series of most of these station datasets display cooling trends from 1930-1960. The one main exception is the data from Lourenço Marques (Berkeley Earth ID: 156935) which shows more or less continuous warming from 1920 onwards.

If we wish to incorporate these extra stations into the MTA then we need to change the MRT period to the interval 1931-1960 when most of this extra data was recorded. This is what I have done to generate the data in Fig. 78.6 below. The other significant change was to discard the data from Lourenço Marques (aka Maputo) from the MTA. The reason for doing this was that, while this station clearly has the longest set of temperature data in Mozambique (it has temperature data from as far back as 1892), its temperature trend is an outlier. This is probably because the station is located in the capital city Maputo and is more prone to the urban heat island (UHI) effect than most other stations in the country. I should note that this outlier behaviour of capital cities is not unusual. The same was seen for Jakarta in Indonesia (see Post 31) as well as for Sydney and Melbourne in Australia.


Fig. 78.6: The mean temperature trend relative to the 1931-1960 monthly averages for stations in Mozambique with over 300 months of data but excluding Lourenço Marques. The best fit is applied to the monthly mean data from 1921 to 1980 and has a positive gradient of +0.16 ± 0.12 °C per century.


The result of this change of MRT, together with the removal of the data from Lourenço Marques, is to completely change the temperature trend before 1940 (see Fig. 78.6 above). While the trend after 1980 still exhibits a warming of 0.6°C, the trend before 1980 is now neutral but with significant natural variability. It is also more reliable as it is based on data from more stations than previously (see Fig. 78.7 below). This would suggest that the temperature trend in Fig. 78.7 is a better representation of the true behaviour of the Mozambique climate over the last 100 years than is the trend in Fig. 78.2. It also provides more evidence to suggest that anthropogenic climate change is really only a post-1980 phenomenon and not one that began in 1850.


Fig. 78.7: The number of station records included each month in the mean temperature anomaly (MTA) trend for Mozambique in Fig. 78.6.


Summary

The data shows that there is clearly strong warming of almost 0.6°C in Mozambique after 1980 (see Fig. 78.2).

Before 1980 the climate appears to be stable (see Fig. 78.6).

Overall this suggests that the warming seen in Mozambique after 1980 is probably real as it coincides with the period of greatest anthropogenic carbon dioxide production. It is also similar in timing and magnitude to temperature rises seen elsewhere around the world as I have shown previously.


Acronyms

BE = Berkeley Earth.

MRT = monthly reference temperature (see Post 47).

MTA = mean temperature anomaly.