Showing posts with label Norway. Show all posts

Saturday, September 24, 2022

138: Evidence against temperature adjustments #3 (Scandinavia)

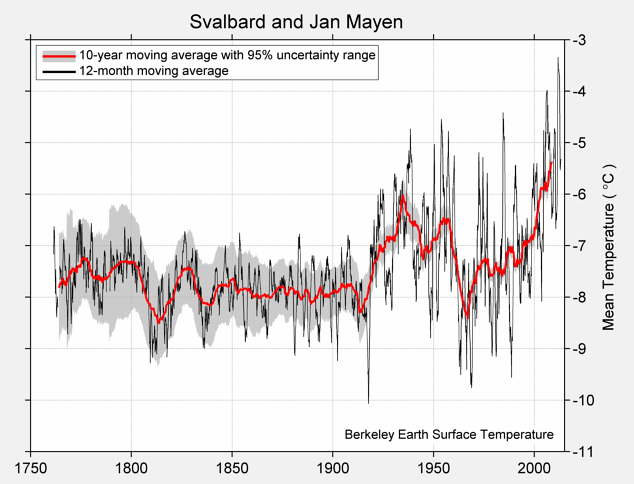
One of the main aims of this blog has been to investigate the extent to which the various datasets in the global temperature record have been adjusted and to ascertain both the impact of these adjustments and their validity. Most of the blog posts for individual countries or territories have sought to quantify the magnitude of these adjustments by calculating two versions of the mean temperature anomaly (MTA) for each region; one based on its raw unadjusted data and a second using Berkeley Earth adjusted data. Then the two are compared and the difference calculated. This difference is often considerable and often shows that the adjustments have increased the amount of reported warming. But I have also investigated the second issue, that of validity. One way to do this is to compare the MTA for neighbouring regions or different data samples from the same region. 

The rationale is as follows. If there are errors in the data that are sufficient to affect the MTA, then comparing MTAs from different samples from the same region, or samples from adjacent regions that would be expected to be almost identical, could highlight the errors. Of course any difference between MTAs from different regions does not prove that the data is wrong; it may be that the regions aren't as similar as one supposed. But if the data is virtually identical then that does suggest both that the temperature trends for the two samples or regions are behaving the same, and that any data errors in the temperature datasets (which are likely to be numerous) are not significant and so are not in need of correction or adjustment.

In Post 57 I used this approach to compare the temperature trends of neighbouring countries in central Europe (Germany, Czechoslovakia, Austria and Hungary). The results showed that if the MTA for a country was determined using data from more than about fifteen different station records then there was little difference between MTAs for different countries, and thus very little error in the MTA of each country. This is because of a property of statistics called regression towards the mean. This basically states that if any dataset contains errors in its measurements (which most data does), and those errors are random in their size and distribution (which they often are), then the errors will tend to cancel each other when you average the data. Moreover, the more data you average, the greater the cancellation of errors and so the more accurate will be the result. If errors don't cancel, then that is because the errors are systematic not random, so the process also helps to identify these as well.

In Post 67 I repeated this process for temperature data from the USA. In this case instead of comparing data from adjacent regions I compared different samples of one hundred stations from the same region: the entire contiguous United States. The result was the same as in Post 57 with each sample exhibiting an identical temperature trend over time with identical fluctuations in the 5-year moving average of the trend.

In this post I will repeat the country comparison of Post 57 but using the 5-year moving average of the temperature trend data from the four neighbouring Scandinavian countries of Norway, Sweden, Finland and Denmark. These trends were determined in Post 135, Post 136, Post 137 and Post 48 respectively. The results are shown in Fig. 139.1 below.


Fig. 138.1: A comparison of the 5-year average temperature trends since 1700 for Norway, Finland and Denmark compared to that of Sweden. The trends for Finland and Norway are offset by ±3°C for clarity.


In Fig. 139.1 I have compared the trends of Norway, Finland and Denmark with that of Sweden. The reasons for choosing Sweden as the comparator were both geographic and practical. It sits between the other three countries and so is a near neighbour for each (Finland and Denmark are not near neighbours so would not be good comparators). But it also has the most stations of the four countries and so should have the most reliable trend.

The data in Fig. 139.1 clearly shows that the trends for all four countries are very similar after 1900 but diverge as one looks further back in time towards 1800. The reason for this is the reduction in station numbers seen in each country as one moves back in time from 1950 (see Fig. 138.2 below). Given that it seems that somewhere between ten and thirty stations are needed in the MTA average in order for the errors to be minimized, we can see from Fig. 138.2 that this condition is satisfied for all four countries after 1890. That is why the MTAs diverge before 1890 but are very similar after that date.


Fig. 138.2: The number of station records included each month in the averaging for the mean temperature trends in Fig. 138.1.


If we just consider the data after 1850 we see that the agreement between trends for the different countries is remarkably good after 1890 (see Fig. 138.3 below). The agreement between Norway and Sweden, and Finland and Sweden are both particularly good to the point of their three trends being almost identical. There is also excellent agreement between Denmark's trend and that of Sweden after 1980 but less so before. This is probably the result of Denmark not only having much fewer stations than the other three countries, but also having fewer than ten stations before 1975.


Fig. 138.3: A comparison of the 5-year average temperature trends since 1850 for Norway, Finland and Denmark compared to that of Sweden. The trends for Finland and Norway are offset by ±3°C for clarity.


Summary

The data in Fig. 138.3 once again demonstrates the futility of temperature adjustments. The fact that the mean temperature anomalies (MTAs) of Norway, Sweden and Finland agree so well for over 120 years from 1890 onwards without data adjustments indicates that the averaging process alone can eliminate most errors.

The Denmark data also adds weight to the conjecture that between ten and thirty stations are needed in the average in order to eliminate most of the data errors. As the error size decreases with the square root of the sample size, an average of 25 datasets should decrease the error size by 80% (reducing each error to a fifth of its nominal value). 

Comparing the data of these four countries in this way also gives us more confidence in the determining the true nature of the regional temperature trend. All the data after 1900 pretty much agree so we can conclude that temperatures from 1900 to 1980 rose marginally by less than 0.3°C and then jumped by about 1°C in the 1980s. But this jump is still only comparable to the size of the fluctuations in the 5-year average.

From 1850 to 1900 both Denmark and Norway diverge from Sweden slightly but in different directions. But this is based on a comparison of only one or two stations in each case and so is not unexpected.


Monday, September 5, 2022

135: Norway - temperature trends STABLE before 1980

Over the next four posts I will look at the temperature data of Scandinavia starting with Norway. Like the rest of Scandinavia, Norway has some of the best temperature data in Western Europe despite having large areas with low population densities and harsh Arctic climates. Some of the temperature data extends back to the mid-eighteenth century. What this data shows is that for two hundred years up to 1980 the climate was more or less stable and exhibited no significant temperature increase. Then around 1988 the mean temperature appears to jump abruptly by about 1°C. This pattern is also seen in much of the rest of Europe as I first demonstrated in Post 44.

In total Norway has nineteen long stations with over 1200 months of data before 2014 and 78 medium stations with over 480 months of data (for a full list of stations see here). Their approximate locations are shown on the map in Fig. 135.1 below. The stations are fairly evenly distributed across the country with thirty of the stations lying within the Arctic Circle, but there does appear to be a greater concentration in the south and a relatively low number of stations between Trondheim and Tromsø in the middle of the country. It is also apparent that over 60% of stations are located on or near the coast.


Fig. 135.1: The (approximate) locations of the 97 longest weather station records in Norway. Those stations with a high warming trend between 1911 and 2010 are marked in red while those with a cooling or stable trend are marked in blue. Those denoted with squares are long stations with over 1200 months of data, while diamonds denote medium stations with more than 480 months of data.


In order to quantify the changes to the climate of Norway the temperature anomalies for all stations with over 480 months of data before 2014 were determined and averaged. This was done using the usual method as outlined in Post 47 and involved first calculating the temperature anomaly each month for each station, and then averaging those anomalies to determine the mean temperature anomaly (MTA) for the country. This MTA is shown as a time series in Fig. 135.2 and clearly shows that temperatures were fairly stable up until 1980. However at some point in the 1980s (probably in 1988) the mean temperature appears to increase abruptly by about 1°C.


Fig. 135.2: The mean temperature change for Norway since 1880 relative to the 1961-1990 monthly averages. The best fit is applied to the monthly mean data from 1881 to 1980 and has a positive gradient of +0.23 ± 0.16 °C per century.


The process of determining the MTA in Fig. 135.2 involved first determining the monthly reference temperatures (MRTs) for each station using a set reference period, in this case from 1961 to 1990, and then subtracting the MRTs from the raw temperature data to deliver the anomalies. If a station had at least twelve valid temperatures per month within the MRT interval then its anomalies were included in the calculation of the mean temperature anomaly (MTA). The total number of stations included in the MTA in Fig. 135.2 each month is indicated in Fig. 135.3 below. The peak in the frequency between 1960 and 1990 suggests that the 1961-1990 interval was indeed the most appropriate to use for the MRTs.


Fig. 135.3: The number of station records included each month in the mean temperature anomaly (MTA) trend for Norway in Fig. 135.2.


The data in Fig. 135.3 indicates that the greatest coverage of the country for temperature data is after 1950 with up to 93 long and medium stations in operation at any one time. This drops to about twenty in 1930 and to less than five before 1850. This means that the MTA for Norway before 1890 will be less reliable than its values after 1950. Note that a reliable MTA generally needs data from at least sixteen stations (see Post 57 for evidence). However if we calculate the MTA for Norway back to 1760 we obtain the trends shown in Fig. 135.4 below. These show that the MTA remains stable for much of the two hundred years before 1980 but the noise level increases before 1800 when the MTA is dependent on only one station: Trondheim.


Fig. 135.4: The mean temperature change for Norway since 1760 relative to the 1961-1990 monthly averages. The best fit is applied to the monthly mean data from 1781 to 1980 and has a slight positive gradient of +0.06 ± 0.06 °C per century.


If we next consider the change in temperature based on Berkeley Earth (BE) adjusted data we get the MTA data in Fig. 135.5 below. This again was determined by averaging each monthly anomaly from the 97 longest stations and suggests that the climate was fairly stable before 1880 but then warmed by over 1°C thereafter. In fact the 10-year average suggests a warming of over 1.5°C. Not only that but the warming is more continuous in nature than the raw data in Fig. 135.4 actually shows.


Fig. 135.5: Temperature trends for Norway based on Berkeley Earth adjusted data. The best fit linear trend line (in red) is for the period 1876-2010 and has a positive gradient of +0.86 ± 0.04°C/century.


Comparing the curves in Fig. 135.5 with the published Berkeley Earth (BE) version for Norway in Fig. 135.6 below we see that there is good agreement between the two sets of data. This indicates that the simple averaging of anomalies used to generate the BE MTA in Fig. 135.5 using adjusted data is as effective and accurate as the more complex gridding method used by Berkeley Earth in Fig. 135.6. In which case simple averaging should be just as effective and accurate in generating the MTA using raw unadjusted data in Fig. 135.4 and Fig. 135.2. In other words, the discrepancy between the adjusted data in Fig. 135.5 and the unadjusted data in Fig. 135.4 cannot be due to the averaging process. Any form of weighted averaging would also not affect the results.


Fig. 135.6: The temperature trend for Norway since 1750 according to Berkeley Earth.


Most of the differences between the MTA in Fig. 135.4 and the BE versions using adjusted data in Fig. 135.6 are instead mainly due to the data processing procedures used by Berkeley Earth. These include homogenization, gridding, Kriging and most significantly breakpoint adjustments. These lead to changes to the original temperature data, the magnitude of these adjustments being the difference in the MTA values seen in Fig. 135.4 and Fig. 135.5.

The magnitudes of these adjustments are shown graphically in Fig. 135.7 below. The blue curve is the difference in MTA values between adjusted (Fig. 135.5) and unadjusted data (Fig. 135.4), while the orange curve is the contribution to those adjustments arising solely from breakpoint adjustments. The overall adjustment from 1880 to 2013 is small, less than +0.2°C. The main impact is to change the shape of the long term trend from a step-like jump in Fig. 135.4 to a more continuous increase in Fig. 135.5. This involves raising temperatures between 1920 and 1980 by 0.2°C while lowering slightly temperatures before 1920.


Fig. 135.7: The contribution of Berkeley Earth (BE) adjustments to the anomaly data in Fig. 135.5 after smoothing with a 12-month moving average. The blue curve represents the total BE adjustments including those from homogenization. The linear best fit (red line) to these adjustments for the period 1876-2010 has a positive gradient of +0.143 ± 0.005 °C per century. The orange curve shows the contribution just from breakpoint adjustments.


Summary

According to the raw unadjusted temperature data, the climate of Norway remained stable for over two hundred years up until the 1980s (see Fig. 135.4). Then it suddenly increased in temperature by 1°C. Why?

In contrast, adjusted temperature data from Berkeley Earth claims to show that the climate of Norway has warmed more or less continuously since 1860 by over 1.5°C (see Fig. 135.4 and Fig. 135.5).


Acronyms

BE = Berkeley Earth.

MRT = monthly reference temperature (see Post 47).

MTA = mean temperature anomaly.

List of all stations in Norway with links to their raw data files.


Wednesday, July 27, 2022

123: Svalbard - temperature trends STABLE to 2000

One of the most notable features of Svalbard is its location. It is one of the most northerly inhabited regions on the planet, located 900 km from the North Pole and almost 1000 km from the northern coast of Norway. As a result it is probably the best source of temperature data that we have for the Arctic, particularly given that there is no significant temperature data available within a radius of 800 km of the North Pole as I showed in Post 118.

That said, there are only seven  stations in Svalbard that have over 480 months of data. Of these only two have over 1000 months of data with one being a long station with over 1200 months of data. The remaining five are medium stations with over 480 months of data (for a list see here). Although the Svalbard archipelago is a part of Norway, its distance from Norway implies that its climate is likely to be rather different. For that reason I am studying it separately in this post rather than with Norway (which I will examine later).


Fig. 123.1: The mean temperature change for Svalbard since 1900 relative to the 1956-1985 monthly averages. The best fit is applied to the monthly mean data from 1921 to 2000 and has a negative gradient of -0.46 ± 0.37 °C per century.


What the data that we do have for Svalbard tells us is that the change in climate since 1920 is very similar to that seen for Jan Mayen in Post 122. The climate cooled slightly until 2000 and then warmed by about 2°C (see Fig. 123.1 above). However this warming is still smaller in magnitude than the variations seen in the 5-year average of up to 4°C.

In order to quantify the changes to the climate of Svalbard the temperature anomalies for each of the seven stations with the most data were determined and averaged. This was done using the usual method as outlined in Post 47 and involved first calculating the temperature anomaly each month for each station, and then averaging those anomalies to determine the mean temperature anomaly (MTA) for the region. The anomalies were determining relative to the monthly reference temperatures (MRTs) using a set reference period, in this case from 1956 to 1985. The total number of stations included in the MTA in Fig. 123.1 each month is indicated in Fig. 123.2 below. The peak in the frequency between 1970 and 1980 suggests that the 1956-1985 interval was indeed the most appropriate to use for the MRTs.


Fig. 123.2: The number of station records included each month in the mean temperature anomaly (MTA) trend for Svalbard in Fig. 123.1.


The locations of the seven stations with the most temperature data are shown in the map in Fig. 123.3 below. Most stations are clustered around Barentsburg with two situated on the outer islands of Hopen to the southeast and Bear Island (as in the Alistair Maclean novel and film) to the south.


Fig. 123.3: The (approximate) locations of the seven longest weather station records in Svalbard. Those stations with a high warming trend between 1911 and 2010 are marked in red while those with a cooling or stable trend are marked in blue. Those denoted with squares are long stations with over 1200 months of data, while diamonds denote medium stations with more than 480 months of data.


If we next consider the change in temperature based on Berkeley Earth (BE) adjusted data we get the MTA data shown in Fig. 123.4 below. This again was determined by averaging each monthly adjusted anomaly from the seven longest stations in Svalbard. The mean temperature follows a similar trajectory to that of the unadjusted data in Fig. 123.1 with temperatures over a 10-year average (orange curve) fluctuating by over 2°C and a large peak occurring around 1930. Temperatures in 2010 are also about 0.5°C higher than in 1930.


Fig. 123.4: Temperature trends for Svalbard based on Berkeley Earth adjusted data. The best fit linear trend line (in red) is for the period 1921-2000 and has a negative gradient of -0.72 ± 0.15°C/century.


Comparing the curves in Fig. 123.4 with the published Berkeley Earth (BE) version for Svalbard and Jan Mayen in Fig. 123.5 below shows that there is good agreement between the two sets of data even though Fig. 123.5 includes data from Jan Mayen. This indicates that the simple averaging of anomalies used to generate the BE MTA in Fig. 123.4 is as effective and accurate as the more complex gridding method used by Berkeley Earth in Fig. 123.5. In which case simple averaging should be just as effective and accurate in generating the MTA using raw unadjusted data in Fig. 123.1 even though the geographical distribution of stations is far from homogeneous, as was shown in Fig. 123.3. What is truly remarkable about the graph in Fig. 123.5 below is that it suggests that Berkeley Earth thinks it can determine the mean temperatures for Svalbard and Jan Mayen as far back as 1760 even though there is no data before 1910.


Fig. 123.5: The temperature trend for Svalbard and Jan Mayen since 1750 according to Berkeley Earth.


The similarity in the two sets of data, Fig. 123.1 and Fig. 123.4, is reflected in the scale of the adjustments made to the original data by Berkeley Earth. The magnitudes of these adjustments are shown graphically in Fig. 123.6 below. The blue curve is the difference in MTA values between adjusted (Fig. 123.4) and unadjusted data (Fig. 123.1), while the orange curve is the contribution to those adjustments arising solely from breakpoint adjustments.

In this case neither set of adjustments is particularly large. The most significant adjustment is for data after 1990 which is adjusted downwards apparently to reduce the extent of the temperature rise seen after 1990 in Fig. 123.1. The other significant adjustment is for data between 1940 and 1960. The effect of this appears to be to reduce the size of the temperature peak before 1960. Neither of these adjustments significantly affect the overall trend of the data other than to reduce the warming after 2000 to values similar to those seen in BE adjusted trends for other regions.


Fig. 123.6: The contribution of Berkeley Earth (BE) adjustments to the anomaly data in Fig. 123.4 after smoothing with a 12-month moving average. The blue curve represents the total BE adjustments including those from homogenization. The linear best fit (red line) to these adjustments for the period 1921-2000 has a slight negative gradient of -0.13 ± 0.03 °C per century. The orange curve shows the contribution just from breakpoint adjustments.


Summary

According to the raw unadjusted temperature data, the climate of Svalbard has remained fairly stable since 1930 with possibly some cooling, but may have warmed by up to 2°C since 2000 (see Fig. 123.1). Any warming since 2000 is still comparable to the natural variations in temperature seen over the previous eighty years.

Over the same period the adjusted temperature data from Berkeley Earth appears to show similar climatic variations (see Fig. 123.4) to the unadjusted (see Fig. 123.1).

Berkeley Earth has estimated the climate variations for Svalbard as far back as 1760 (see Fig. 123.5) despite there being no reliable temperature data before 1910.

The patterns seen in the temperature data for Svalbard in Fig. 123.1 (decline before 1990 and warming after) are similar to those seen previously for nearby islands of Greenland (Fig. 119.1 in Post 119), Iceland (Fig. 120.1 in Post 120), the Faroes (Fig. 121.1 in Post 121) and Jan Mayen (Fig. 122.2 in Post 122).


Acronyms

BE = Berkeley Earth.

MRT = monthly reference temperature (see Post 47).

MTA = mean temperature anomaly.

Link to list of all stations in Svalbard and their raw data files.


Monday, July 25, 2022

122: Jan Mayen - temperature trends VARIABLE

The Norwegian island of Jan Mayen lies in the Arctic Circle approximately 600 km northeast of Iceland, 500 km east of Greenland and almost 1000 km from the coast of Norway. It is just over 50 km long and is inhabited only by a few Norwegian military and meteorological personnel on six month deployments. It does, though, have two weather stations (BE ID: 16234 and BE ID: 157312 with 735 and 1113 months of data respectively) that provide the only temperature data for over 500 km in all directions (see Fig. 122.1 below).


Fig. 122.1: The (approximate) locations of the two longest weather station records in Jan Mayen. Those stations with a high warming trend between 1911 and 2010 are marked in red while those with a cooling or stable trend are marked in blue.


The mean temperature anomaly (MTA) for Jan Mayen is shown in Fig. 122.1 below. From 1920 to 1990 the temperature trend is downward with temperatures falling by about 0.7°C according to the best fit line (red line) or 1.5°C according to the 5-year moving average (yellow line). After 1990 the temperature increases by up to 2°C. Both of these changes are less than the natural variation seen in the 5-year average (yellow curve) so it is impossible to definitively attribute them to climate change.


Fig. 122.2: The mean temperature change for Jan Mayen since 1920 relative to the 1971-2000 monthly averages. The best fit is applied to the monthly mean data from 1921 to 2000 and has a negative gradient of -0.93 ± 0.25 °C per century.


The MTA in Fig. 122.2 is the average of anomaly data from two stations (see Fig. 122.3 below) and was determined using the usual method as outlined in Post 47. The anomalies were determined relative to monthly reference temperatures (MRT) with the MRTs calculated using data from 1971-2000.


Fig. 122.3: The number of station records included each month in the mean temperature anomaly (MTA) trend for Jan Mayen in Fig. 122.2.


Repeating the averaging process using data that has been adjusted by Berkeley Earth (BE) yields the temperature curve shown in Fig. 122.4 below. In this case the 10-year average (orange curve) is broadly similar in shape to the yellow curve in Fig. 122.2, but the temperature fall before 1990 and the rise after are both slightly larger. In both cases, however, the temperatures in 2010 are less than 0.5°C higher than in 1930.


Fig. 122.4: Temperature trends for Jan Mayen based on Berkeley Earth adjusted data. The best fit linear trend line (in red) is for the period 1921-2000 and has a negative gradient of -1.04 ± 0.11°C/century.


The similarity in the two sets of data (Fig. 122.2 and Fig. 122.4) is reflected in the scale of the adjustments made to the original data by Berkeley Earth. The magnitudes of these adjustments are shown graphically in Fig. 122.5 below. The blue curve is the difference in MTA values between adjusted (Fig. 122.4) and unadjusted data (Fig. 122.2), while the orange curve is the contribution to those adjustments arising solely from breakpoint adjustments. In this case neither are particularly large, with data after 1950 being adjusted down by about 0.18°C. The only significant adjustment is for data between 1960 and 1976 which is adjusted upwards by about 0.9°C. The effect of this is to reduce the size of the temperature dip before 1970 seen in Fig. 122.2.


Fig. 122.5: The contribution of Berkeley Earth (BE) adjustments to the anomaly data in Fig. 122.4 after smoothing with a 12-month moving average. The blue curve represents the total BE adjustments including those from homogenization. The linear best fit (red line) to these adjustments for the period 1921-2000 has a slight negative gradient of -0.07 ± 0.04 °C per century. The orange curve shows the contribution just from breakpoint adjustments.


Summary

According to the raw unadjusted temperature data, the climate of Jan Mayen has remained fairly stable since 1930 (see Fig. 122.2).

Over the same period adjusted temperature data from Berkeley Earth appears to show similar climate variations (see Fig. 122.5).

The patterns seen in the temperature data for Jan Mayen in Fig. 122.2 (decline before 1990 and warming after) are similar to those seen previously for nearby islands of Greenland (Fig. 119.1 in Post 119), Iceland (Fig. 120.1 in Post 120) and the Faroes (Fig. 121.1 in Post 121).


Acronyms

BE = Berkeley Earth.

MRT = monthly reference temperature (see Post 47).

MTA = mean temperature anomaly.