It is exactly one year since I started this blog, so I thought it would be a good time to pause and reflect on the developments so far.
The aim of this blog has been to test the claims of climate scientists, to test the physics, and to test the data.
Over the last year I have published 67 blog posts, the majority of which have analysed the temperature records of various countries, states and regions. But I have also considered other aspects of climate change, such as the underlying physics and thermodynamics, as well as looking at the the data analysis and its reliability.
Fig. 68.1: The temperature trend for the Southern Hemisphere since 1820. The best fit is applied to the monthly mean data between 1876 and 1975 and has a negative gradient of -0.12 ± 0.09 °C per century.
Temperature records
So far I have analysed most of the temperature records from the Southern Hemisphere, together with the longest records from the USA and Europe. In few if any cases have the actual trends derived from the raw data agreed with the widely disseminated trends supported by the main climate science groups (NOAA, NASA, Berkeley Earth) and the IPCC.
Temperature trends for Australia and New Zealand showed little additional heating compared to the mid-18th century.
Temperature trends for many South American countries and the South Pacific showed strong cooling. Overall the trend for the whole of South America showed a modest rise of about 0.5°C since 1900 but the picture before 1900 was unclear due to poor data. If it behaved like Australia then the climate would have been just as warm as it is now.
The overall trend for the Southern Hemisphere showed cooling before 1970 and a slight warming of about 0.5°C thereafter.
In Europe there was very little temperature rise for 200 years before 1980 but then a sudden jump of over 1°C in 1988. This is totally at odds with what is conventionally reported.
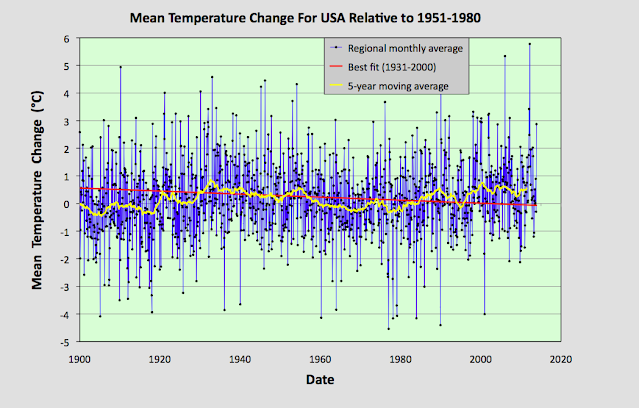
In the USA temperatures have been either stable or decreasing for over 100 years. Yet trends published by NOAA and Berkeley Earth suggest otherwise.
Fig. 68.2: The temperature trend for the USA since 1900. The best fit is applied to the monthly mean data from 1931 to 2000 and has a strong negative gradient of -0.55 ± 0.22 °C per century.
Data analysis
Over the course of this blog's history I have applied a number of data analysis techniques to the temperature data.
In Post 9 I applied fractal geometry to the noise spectrum in order to ascertain the degree of self-similarity in the temperature data. This was pursued further in other posts such as Post 17, Post 27 and Post 42. The results indicate that fluctuations in the temperature record due to natural variations are likely to be significant, even when temperatures are averaged over entire centuries.
In Post 43 I showed that even temperature records from adjacent stations less than one mile apart are likely to disagree by up to 0.25°C purely because of random measurement uncertainties.
In Post 57 and Post 67 I analysed multiple data sets from the EU and the USA respectively and showed that a true regional trend could be obtained simply by averaging multiple station records, and that temperature adjustments applied to the data by climate scientists are both unnecessary and erroneous.
In Post 11 I considered the impact of station separation on the degree of correlation effects between temperature records. This indicated that neighbouring stations were likely to be very strongly correlated. In which case averaging temperature records from multiple stations for a regional trend would lead to a much smaller reduction in the temperature fluctuations than would normally be expected.
Physics
In some of my early blog posts (Posts 12, 13 and 14) I outlined the physics underpinning the Earth's climate and its energy balance.
I then drew on this knowledge to investigate the impact of surface heating due to human energy use. The results are discussed in Post 14 and Post 29, and suggest waste heat from human activities could be responsible for temperature rises of up to 1°C in some countries (e.g. Belgium and The Netherlands) and even more in large cities like London.
Future work
While most of the temperature data from the Southern Hemisphere has now been analysed here in some detail, the same is not true of the Northern Hemisphere. So far only a few European countries have been studied as well as data from Texas. There have also been analyses of the longest records from Europe and the USA in order to generate regional trends.
Future blog posts will look at analysing temperature data from Asia, Africa and the Arctic region. I will also complete analyses of the remaining European countries, some states of the USA (particularly those in the west), Canada and The Caribbean.
The other topic I will address is the issue of the Greenhouse Effect and the role of carbon dioxide in climate change.


No comments:
Post a Comment